Reviewing Overall Performance
To start, head to Displays to review your displays’ performance in aggregate.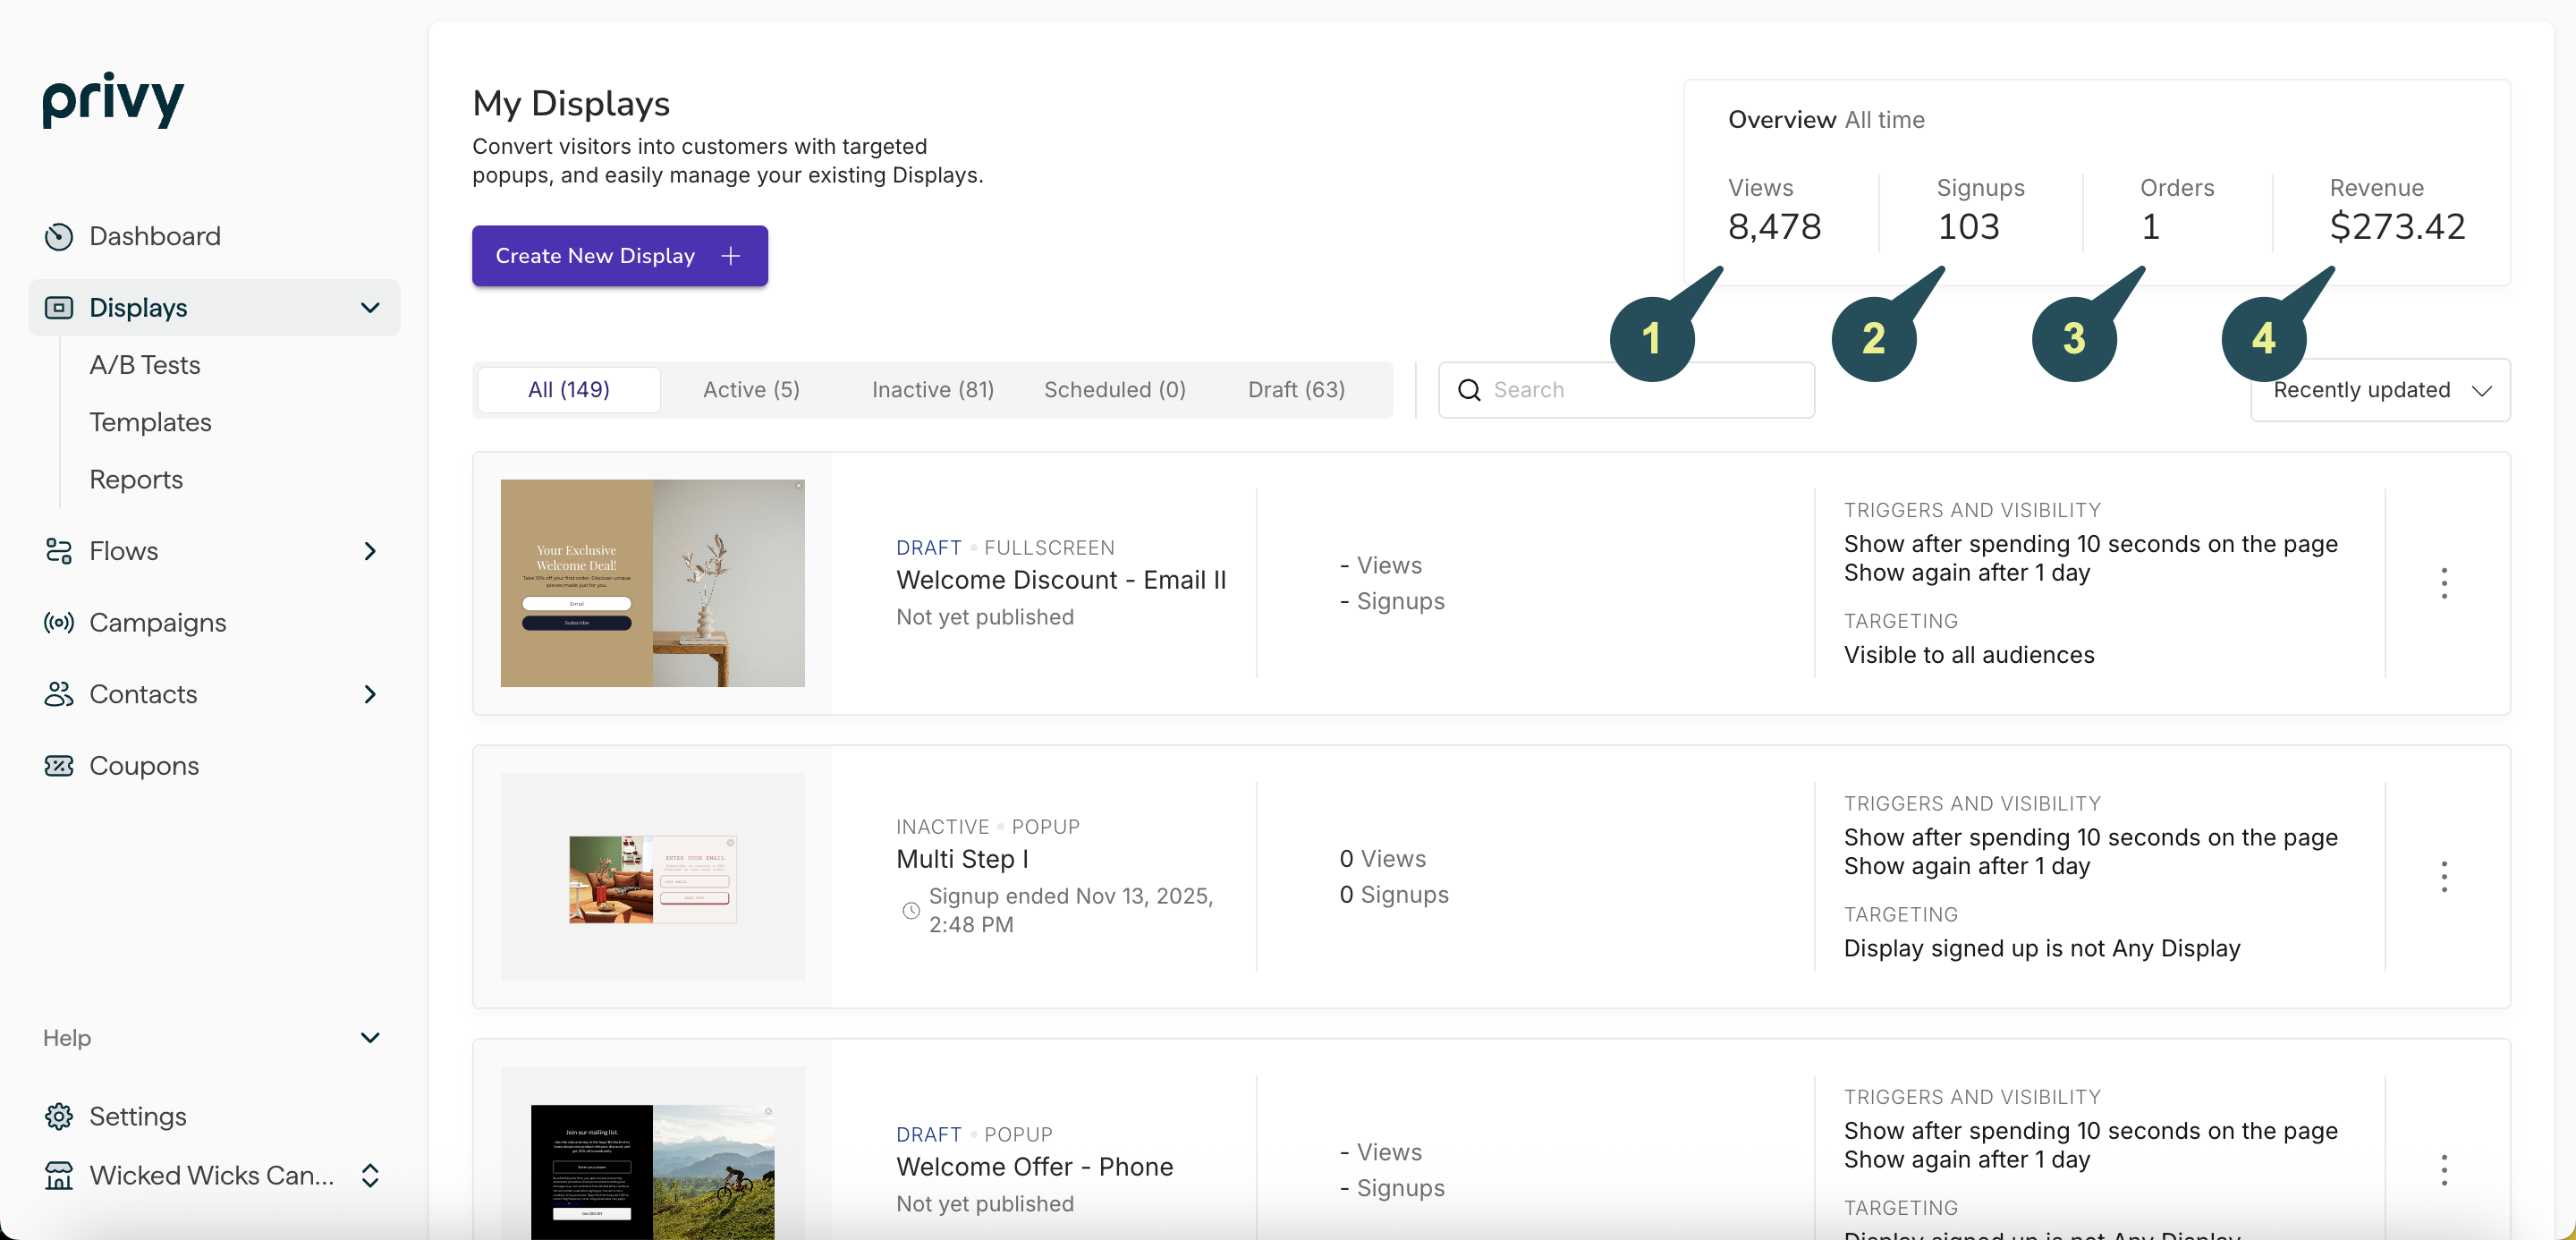
Views
Views
The total number of display views since account creation. A view is registered when the display loads on a visitor’s screen.
Signups
Signups
The total number of display signups since account creation. A sign-up is registered when a visitor submits their information via a display.
Orders
Orders
The total number of orders since account creation. An order is registered when someone signs up for your Privy display and then completes a purchase through your store using the same email address. Privy counts an order regardless of whether or not the customer used a coupon code during checkout.
Revenue
Revenue
The total revenue collected from all contacts who signed up via a Privy display and subsequently made a purchase. This revenue attribution is only available to Privy accounts integrated with a Shopify or BigCommerce storefront.
Reviewing display-specific data
To access display-specific performance information, navigate to the Convert dashboard and locate the desired display. The display’s card provides an overview of its standalone performance, while additional information (e.g., Conversion %) can be accessed by clicking the card and opening a display-specific report.Preview data in the index table
Each display’s performance can be previewed within the index table.
Views
Views
The total number of views this display has received. A view is registered when the display loads on a visitor’s screen.
Signups
Signups
The total number of visitors that signed up by submitting a signup form.
Orders
Orders
The total number of orders placed by visitors who completed a signup.
View data on Display Reports
After clicking on a specific display, additional reporting data will appear.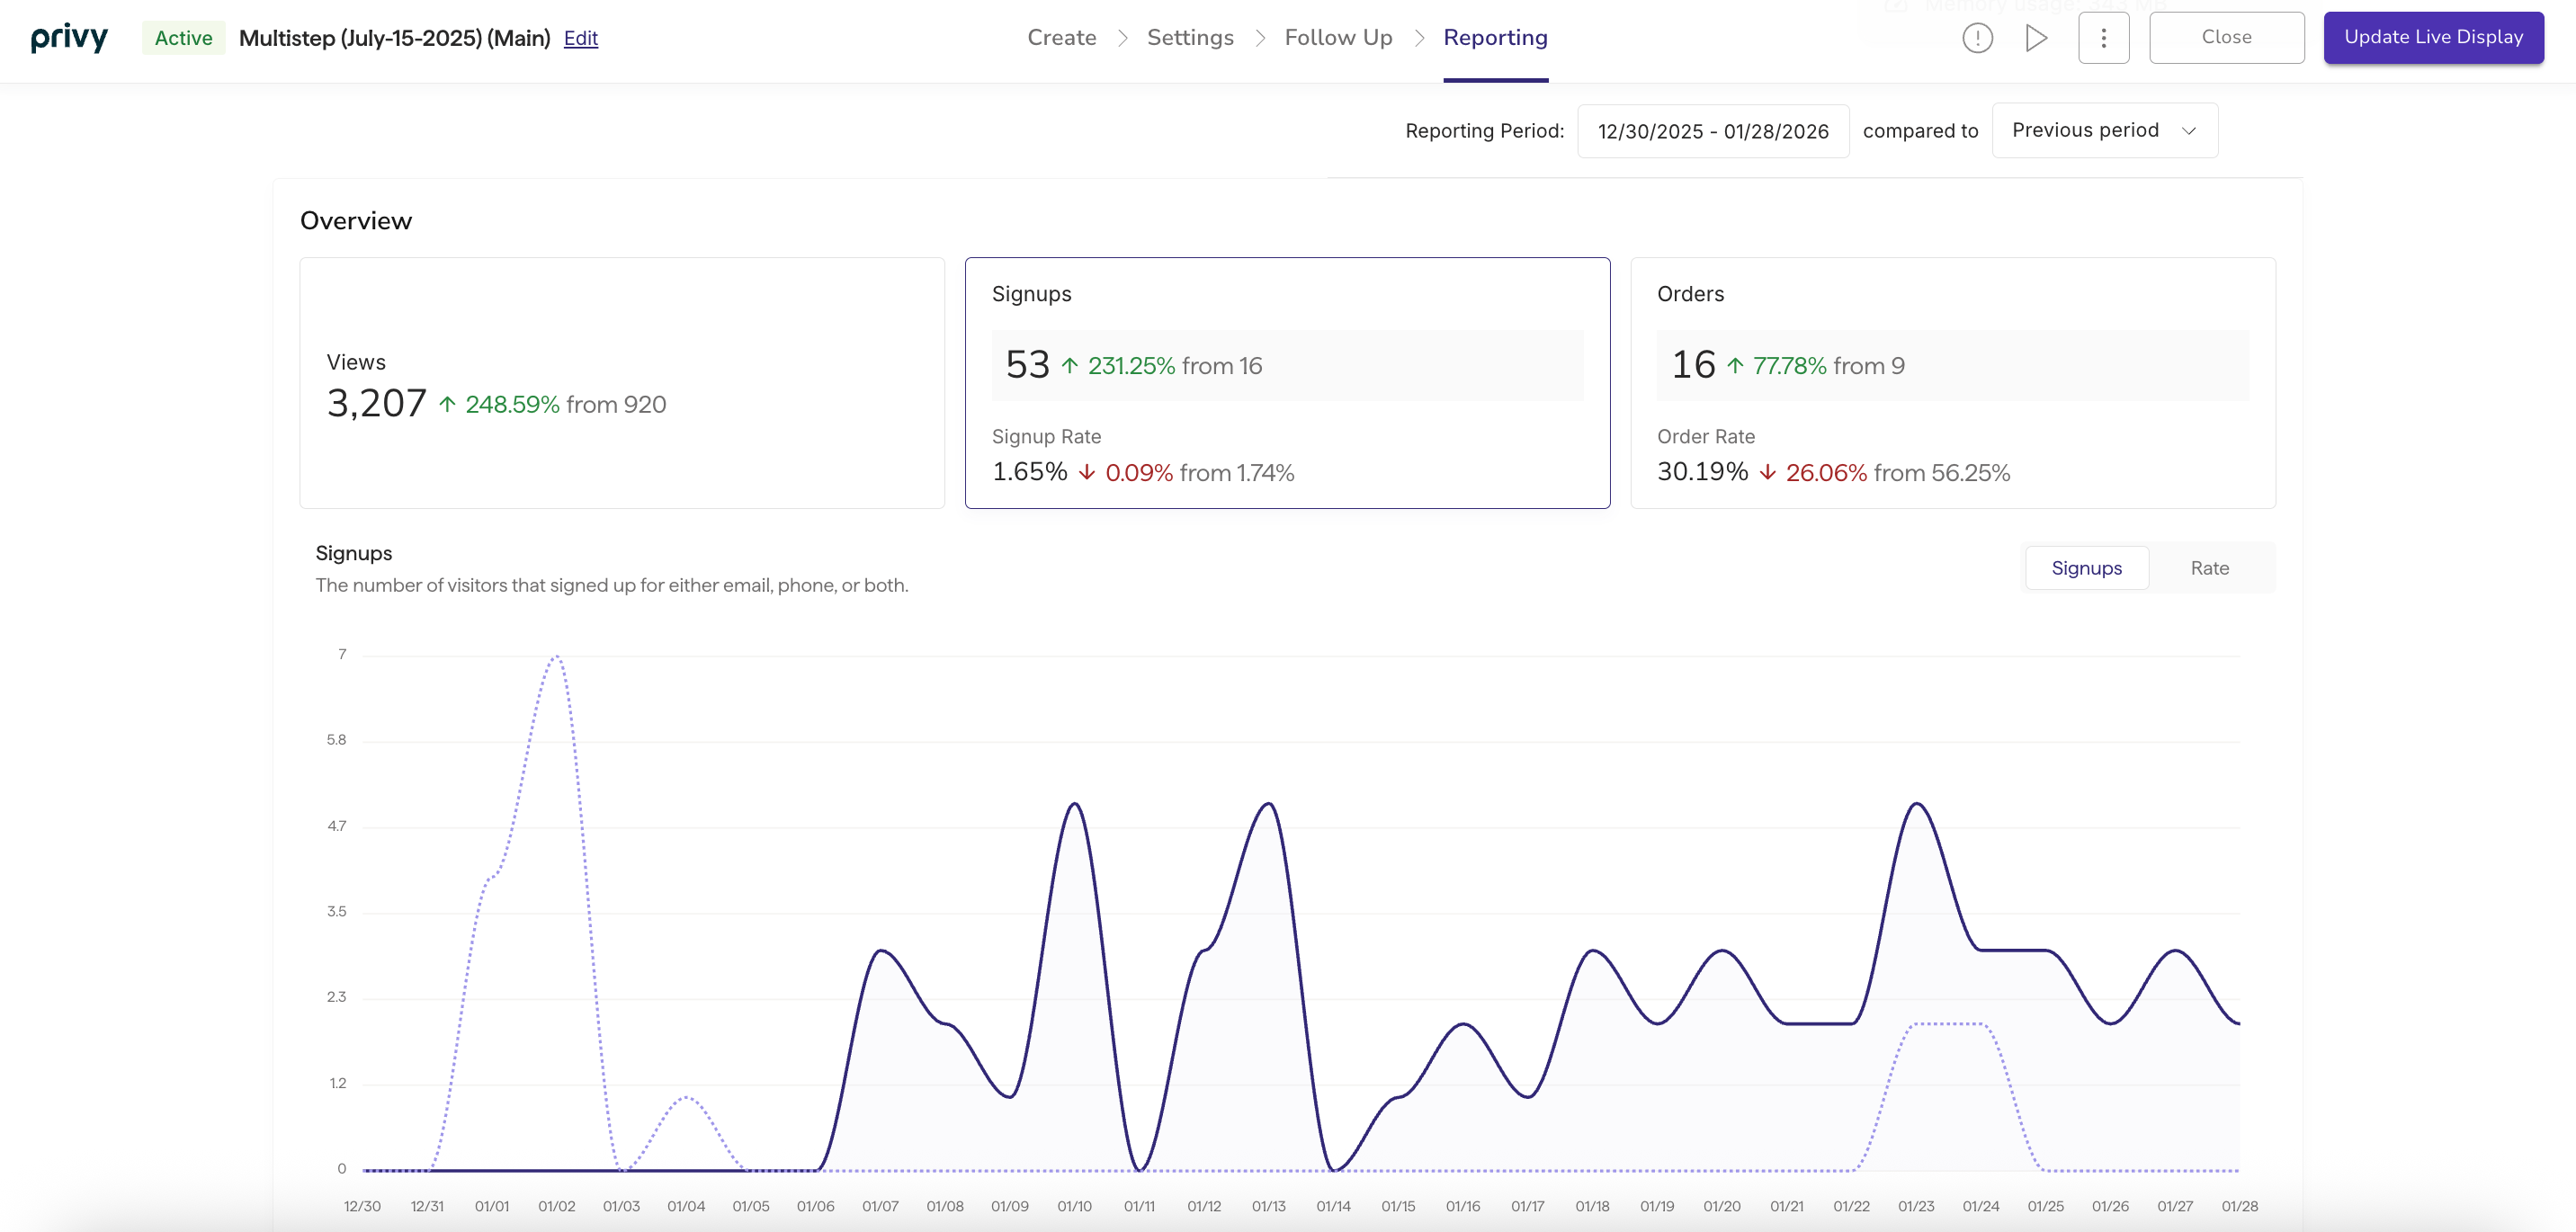
Views
Views
The number of times your display was shown to visitors on your site.
Signups
Signups
The number of visitors that signed up by submitting a signup form.
Signup Rate
Signup Rate
The percentage of views that resulted in a signup event.
Orders
Orders
The number of orders placed by visitors who completed a signup.
Order Rate
Order Rate
The percentage of orders placed by visitors who completed a signup.